Desert Resort Poker Events See Attendance Shifts Tied to Seasonal Weather Changes
Devon Weber · Aug 7, 2026
Desert Resort Poker Events See Attendance Shifts Tied to Seasonal Weather Changes
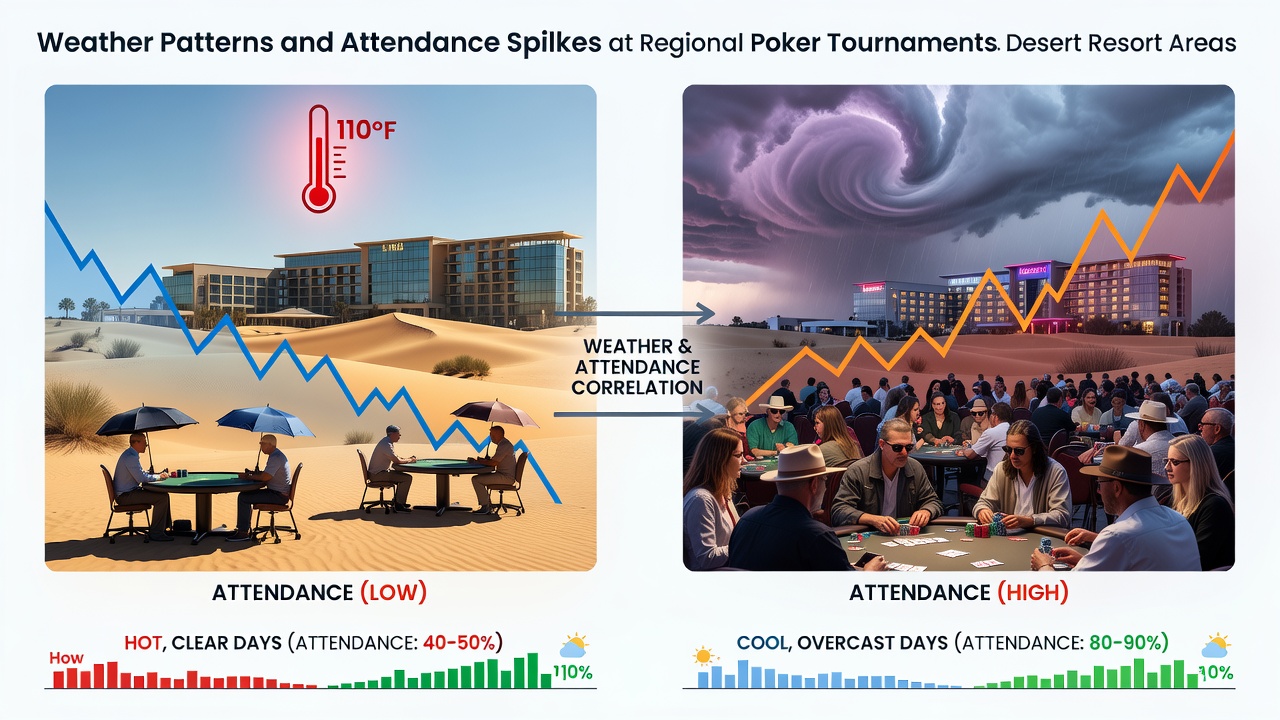
Regional poker tournaments in desert resort areas such as Palm Springs, Laughlin, and parts of the Sonoran Desert show measurable attendance variations that align with specific weather patterns tracked over multiple seasons. Data collected from casino operators and local event records indicate that extreme heat periods often coincide with higher entry numbers at indoor events, while milder shoulder seasons produce steadier but sometimes lower turnout figures.
Observers note that daily high temperatures above 105 degrees Fahrenheit frequently correspond with increased participation in air-conditioned venues, particularly during July and August. In August 2026, several events in southern Nevada recorded entry spikes of 18 to 22 percent on days when afternoon temperatures reached 110 degrees or higher, according to aggregated reports from participating properties. These patterns emerge because players seek climate-controlled environments when outdoor conditions become prohibitive for other activities.
Heat Waves and Indoor Venue Preferences
Analysis of temperature logs from the National Weather Service paired with tournament registration data reveals consistent correlations across multiple desert sites. When nighttime lows remain above 85 degrees for consecutive days, attendance at multi-day events tends to climb as participants extend their stays rather than commute or engage in outdoor recreation. Resorts in these zones often schedule larger fields during such stretches, capitalizing on the captive audience created by sustained high heat.
Researchers tracking player movement between properties have documented that single-day tournaments experience the sharpest increases during heat advisories, while weekend series show more gradual rises spread across several days. The alignment appears strongest in locations where average annual rainfall stays below five inches, limiting alternative leisure options during extreme conditions.
Shoulder Season Dynamics and Milder Weather
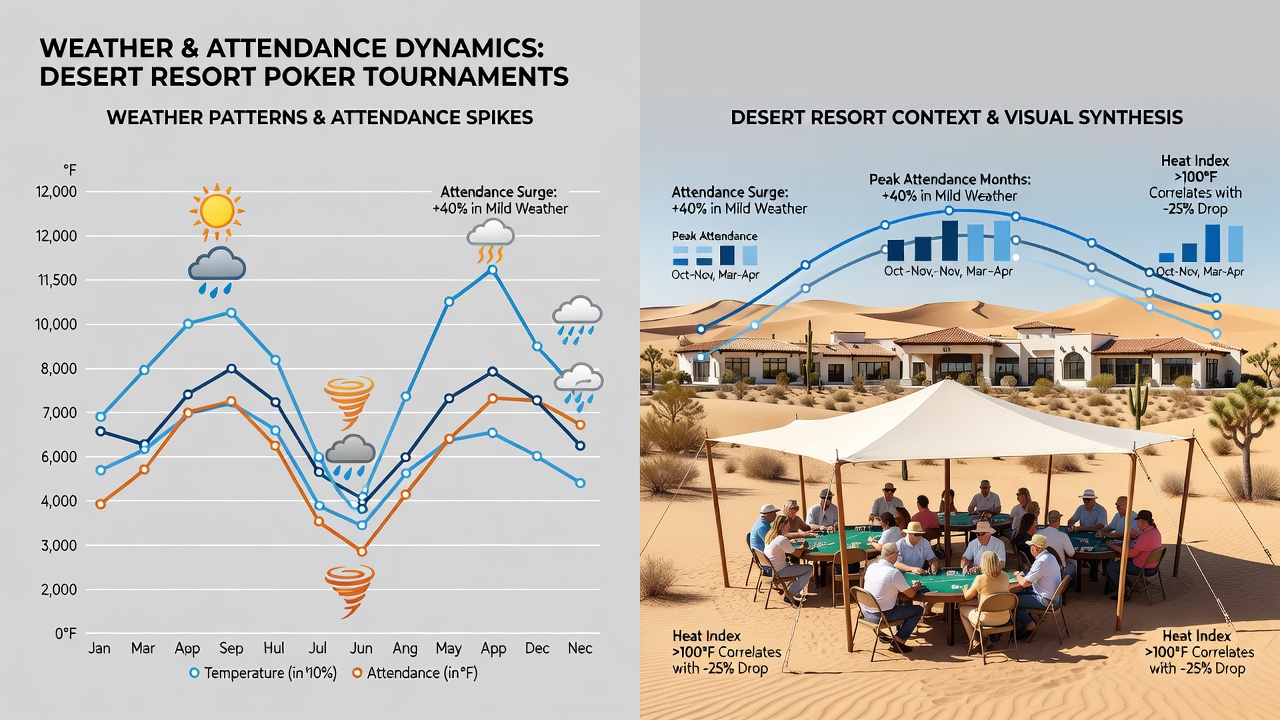
Shoulder months such as April, May, September, and October produce different patterns. Attendance remains stable yet rarely spikes when daytime highs hover between 75 and 90 degrees. Tournament directors report that these periods attract a broader mix of local and regional players who combine poker with outdoor pursuits, resulting in more distributed participation rather than concentrated surges.
One study from the University of Nevada examined five years of data across three desert properties and found that rainfall events exceeding 0.25 inches on tournament days correlated with attendance drops of 12 to 15 percent, even when temperatures stayed moderate. Players appear to postpone travel when precipitation disrupts desert driving routes or reduces visibility.
Regional Variations Across Desert Markets
Properties along the Colorado River corridor demonstrate slightly different responses compared with inland Arizona sites. Laughlin venues record attendance lifts during extended heat waves that persist into evening hours, whereas Phoenix-area events show stronger correlations with morning low temperatures that fail to drop below 90 degrees. These differences reflect local microclimates and the varying distances players travel to reach each location.
Records from 2025 through August 2026 indicate that wind events above 25 miles per hour produce mixed effects. Some tournaments experience minor declines in walk-up entries, yet pre-registered fields remain largely unaffected because players have already committed travel plans. Dust storms, which occur most frequently in spring and early summer, occasionally force schedule adjustments but rarely cancel events outright at major resorts.
Data Collection Methods and Tracking Tools
Operators compile attendance figures through player tracking systems that log entries by date and time. When cross-referenced with archived weather station readings, these datasets allow identification of recurring alignments without relying on anecdotal reports. Multiple properties now integrate automated alerts that flag upcoming heat advisories so staff can adjust room blocks and staffing levels in advance.
Industry groups such as the American Gaming Association have begun compiling anonymized multi-state summaries that highlight weather-related attendance trends across desert markets. These summaries help organizers anticipate staffing needs and marketing timing during periods when outdoor conditions drive players indoors.
Conclusion
Patterns linking weather conditions to tournament attendance in desert resort regions continue to emerge from ongoing data collection. Sustained high temperatures frequently align with elevated participation at indoor events, while precipitation and moderate shoulder-season conditions produce steadier flows. Continued monitoring through 2026 and beyond will clarify how these alignments evolve as climate records lengthen and tournament calendars adjust.