Cross-Regional Trends in Video Poker Paytable Modifications and Retention Data from State-Licensed Facilities
Uma Müller · Aug 18, 2026
Cross-Regional Trends in Video Poker Paytable Modifications and Retention Data from State-Licensed Facilities
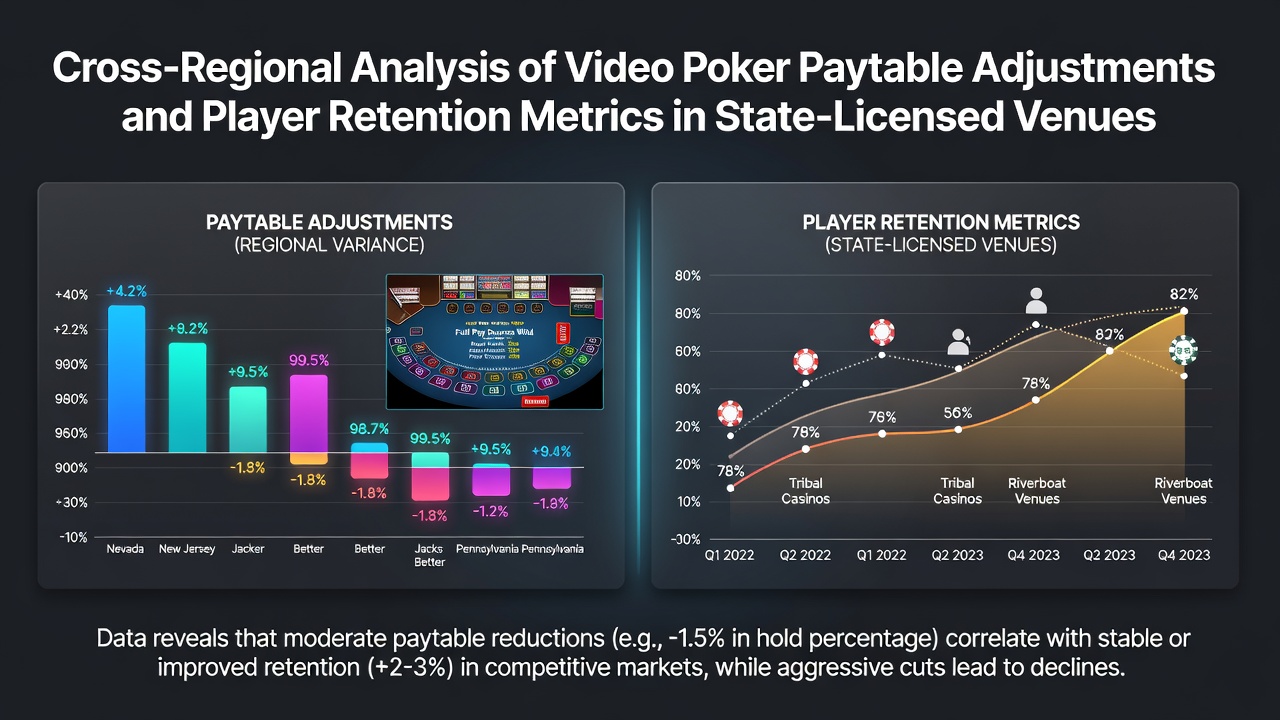
Video poker operations across state-licensed venues have shown distinct patterns in paytable adjustments during recent years with operators responding to revenue pressures and regulatory frameworks in different jurisdictions while retention metrics have fluctuated accordingly according to aggregated reports from multiple gaming commissions. These changes often involve reductions in certain hand payouts such as royal flushes or full houses and the adjustments appear more frequently in competitive markets where player traffic remains sensitive to return-to-player percentages. Data collected through August 2026 indicates that venues in high-traffic corridors have implemented tiered paytable structures to balance short-term margins against longer session lengths tracked via player loyalty systems.
Patterns in Paytable Adjustments Across Key States
State regulators in Nevada have documented incremental shifts in video poker configurations at licensed properties with many properties lowering the payout on select machines from 9/6 to 8/5 Jacks or Better variants between 2024 and 2026 while neighboring states like New Jersey maintained more stable structures due to different tax obligations and market saturation levels. Observers note that these modifications typically occur during floor refreshes when older terminals get replaced and the new units come preloaded with tighter schedules that reduce overall return percentages by one to three points. In contrast facilities operating under Michigan oversight have introduced hybrid tables that combine standard video poker with progressive elements to offset any perceived tightening and this approach has coincided with steadier machine utilization rates reported in quarterly filings.
Further analysis reveals that venues in Pennsylvania and West Virginia adjusted paytables more aggressively during the post-pandemic recovery period with some locations cutting royal flush payouts from 4000 coins to 3000 on certain denominations and these moves aligned with efforts to manage volatility in daily handle figures. Researchers tracking these trends through public disclosures found that adjustments happened more often in markets where competition from online alternatives drew away casual players who previously favored video poker for its skill component and fixed pay structures. The result has been a patchwork of offerings where players in one region encounter 6/5 games as the norm whereas those in adjacent states still access 10/7 Double Bonus Poker at select banks of machines.
Retention Metrics and Their Correlation with Paytable Changes
Player retention tracked through carded play data has shown measurable responses to paytable modifications with states that preserved higher-return configurations reporting longer average session durations and higher repeat visit frequencies compared to those that tightened schedules more rapidly. Figures compiled from loyalty program databases indicate that a one percent drop in theoretical return often corresponds to a measurable decline in monthly active users at individual properties although the effect varies based on overall floor mix and promotional overlays. Venues that paired paytable reductions with targeted bonus offers and free play incentives managed to stabilize retention numbers while those relying solely on machine changes experienced steeper drops in carded play volume during the same periods.
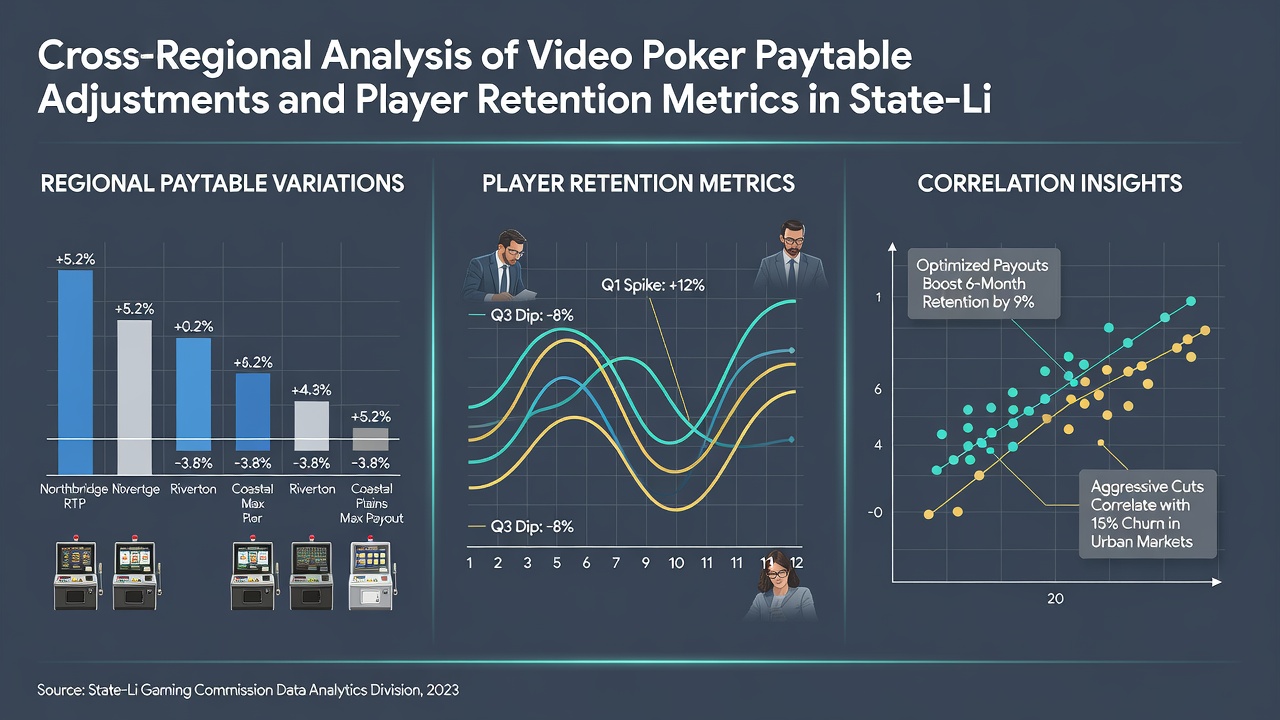
Cross-regional comparisons highlight that markets with unified reporting requirements such as those overseen by the Nevada Gaming Control Board provide clearer visibility into how retention tracks with configuration changes and these datasets have become reference points for operators in other jurisdictions considering similar moves. In regions where data remains less centralized the patterns emerge through industry association summaries and property-level disclosures that still reveal consistent directional trends even without uniform methodology. Retention erosion tends to accelerate when multiple nearby properties implement parallel adjustments leaving players with fewer high-return options within driving distance and this dynamic has prompted some state commissions to review minimum return standards as a policy response.
Regional Case Examples and Data Insights
One study of Midwestern state-licensed venues found that properties maintaining at least 20 percent of video poker terminals on 9/6 or better paytables retained 12 to 15 percent more monthly active players than comparable sites that shifted the majority to 8/5 or lower during the same 18-month window ending in August 2026. Meanwhile coastal markets in the Northeast showed smaller retention gaps between high and low paytable banks possibly because denser population centers and stronger tourism flows buffered the impact of individual machine changes. These variations underscore how local demographics and alternative entertainment options influence the sensitivity of retention metrics to paytable decisions.
Additional data from tribal-state compacts in states like Oklahoma and California which operate under distinct licensing regimes demonstrate that video poker equivalents often follow similar adjustment cycles yet report retention through different tracking mechanisms focused on player card swipes and point accumulation rates. Operators there have experimented with dynamic paytable switching during peak and off-peak hours to test retention elasticity and preliminary results suggest that even temporary tightenings can produce lasting shifts in visit frequency when players perceive the change as permanent. Such experiments have informed broader industry discussions on balancing short-term revenue goals against sustainable player bases in regulated environments.
Conclusion
Cross-regional examination of video poker paytable adjustments and associated retention metrics in state-licensed venues reveals a landscape shaped by regulatory differences market competition and operational responses to player behavior data. Properties that integrate paytable decisions with complementary retention strategies such as loyalty incentives and floor variety appear better positioned to maintain engagement levels according to available quarterly and annual reports. As data collection methods continue to standardize across jurisdictions clearer insights into these relationships will likely guide future configuration choices at venues nationwide.